Drishti: Warehouse & Supply Chain OS
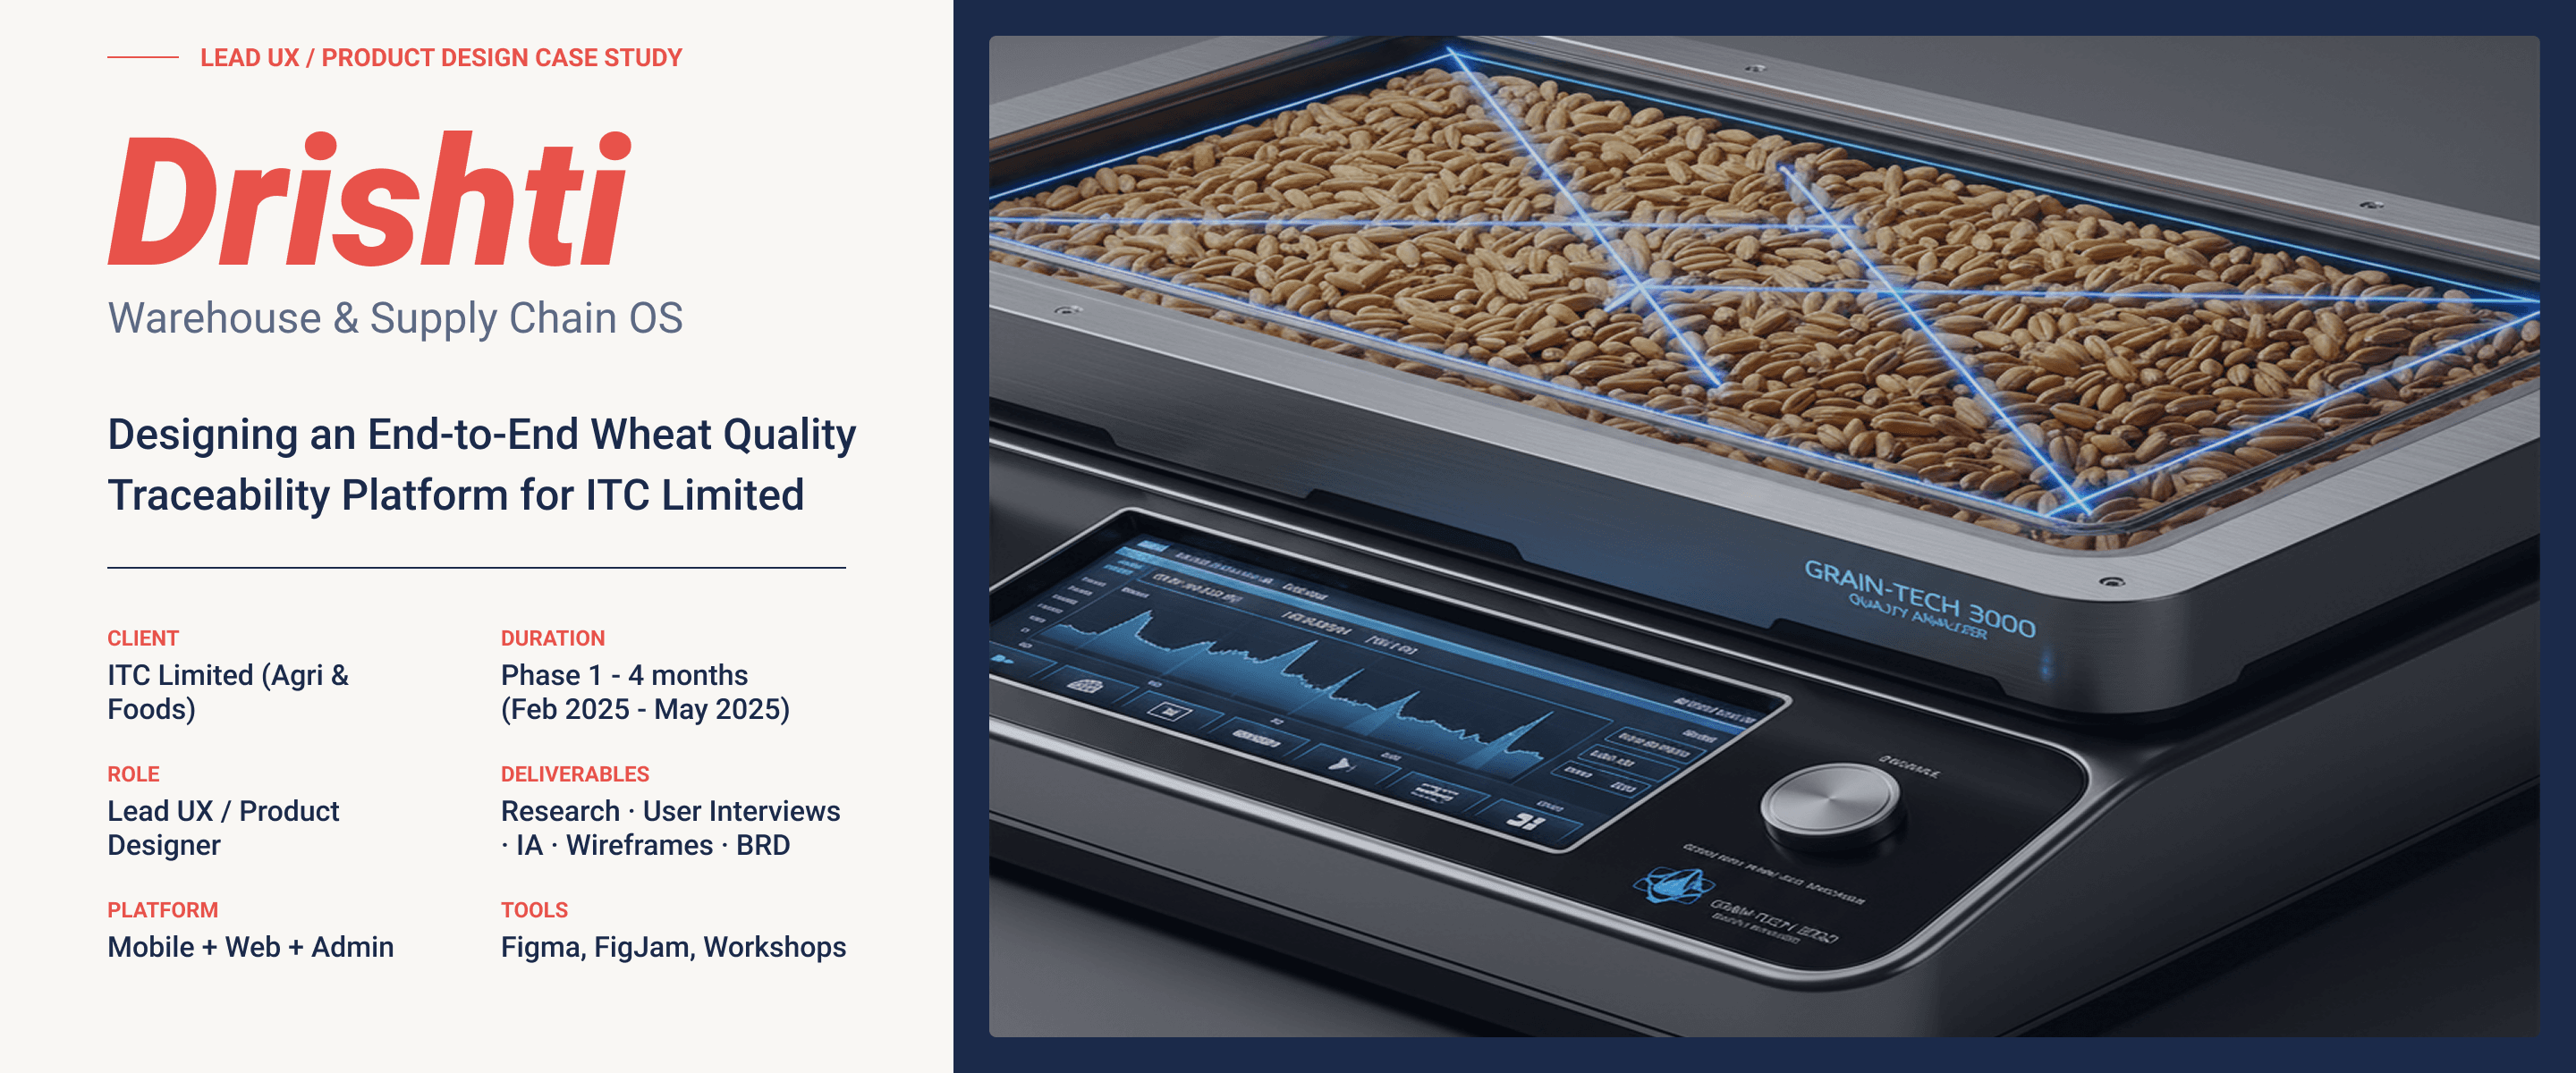
Designing an End-to-End Wheat Quality Traceability Platform for ITC Limited. Orchestrating a ₹6 Crore annual saving through inclusive enterprise design, transforming crop quality procurement into a hardware-integrated traceability engine for mobile, web, and admin portals.
Problem Statement
Supplying quality at scale was hindered by a fragmented supply chain
Lack of Standardization
Physically verifying quality via an operator is dependent on individual skill, making it difficult to repeat across 320+ total nodes. This inconsistency acts as a massive bottleneck for work efficiency.
Lack of Traceability
Wheat sourced from 120+ Hubs and 200+ Nodes creates supply chain blind spots. The manual process makes it nearly impossible to track an under-performing batch back to the original source.
Lack of Centralized Oversight
Without centralized visibility, oversight gaps cause difficulties in mixing varieties, ultimately impacting the final quality of flour (atta) produced at the factory level.
Unforeseen Delays
Manual quality checks are slow. Bottlenecks at the buying site cause a cascading delay through the entire procurement and processing supply chain, increasing operational costs.
Design Process
Aligning diverse stakeholders through a documentation-first strategy
Requirement Gathering
Conducted interviews and shadowing across ABD & FBD teams. Used focus groups to identify core operational pain points and technical constraints of the field staff.
BRD Development
Compiled requirements into a robust Business Requirements Document. Defined functional and non-functional goals, ensuring acceptance criteria were clearly measurable.
Wireframes & Design
Iterative design phase focused on the mobile field app and supervisor dashboard. Annotated specifications ensured a smooth handoff for development.
The Third Way
Initially, two AI models were evaluated. Through stakeholder alignment, a third approach emerged: prioritize a vendor-agnostic BRD first. This ensured the platform solved the underlying business logic regardless of which AI hardware was eventually selected, reducing architectural risk by 40%.
Personas & Role Architecture
We structured a comprehensive role architecture covering 10 distinct personas across 3 tiers (Web Dashboard, Mobile Field Operations, and System Administration) to isolate scope and visual oversight.
TIER 1: WEB DASHBOARD SUPERVISORS
Shubham
ABD Central Supervisor (Agri Business)Scope: Broadest ABD view: warehouses, reports, quality maps, editing warehouse parameters, outward logs.
Pain Point: No visibility into quality trends across 120+ hubs.
Rajesh
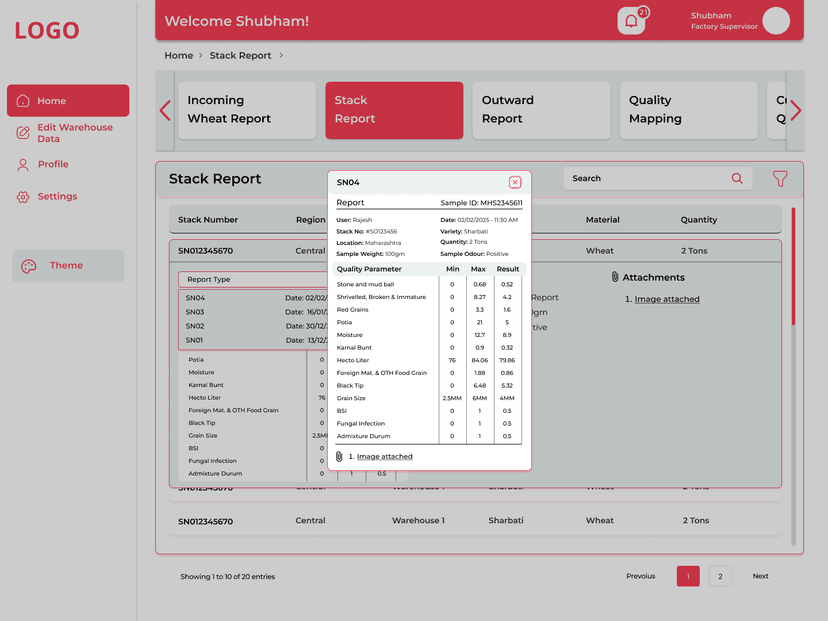
FBD Factory Supervisor (Foods Business)Scope: Single factory incoming: incoming wheat checks, stack reports, current stack quality, moisture reconciliation.
Pain Point: Cannot verify incoming wheat quality against dispatch claims.
Ashok
FBD Regional Supervisor (Foods Business)Scope: Multi-factory regional oversight: quality mapping, cross-location tracking, regional audit summaries.
Pain Point: Difficult to compare quality performance across factories in the region.
Srilekha
FBD Central Supervisor (Foods Business)Scope: Broadest FBD view: all modules, cost of quality analytics, edit factory records, compliance auditing.
Pain Point: No way to correlate quality costs with procurement decisions.
TIER 2: MOBILE FIELD OPERATIVES
WSP (ITC)
Warehouse Sampling PersonScope: Receives wheat bags, scans samples, creates Goods Receipt Note (GRN), performs CHR checks, initiates trace.
Pain Point: Quality assessment depends on subjective operator skill.
WSP (Non-ITC)
Third-Party ContractorScope: Shares identical responsibilities to WSP (ITC) but operates as an external, temporary workforce.
Pain Point: Works in remote areas with poor internet connectivity.
Lab Technician
FBD Lab PersonnelScope: Performs 5 types of lab tests using hardware scanning devices for objective crop telemetry reports.
Pain Point: Manual testing is slow, subjective, and error-prone across 14+ parameters.
External User
Third-Party AuditorScope: Simplified interface: scan crop barcode and queue offline sample details only.
Pain Point: No internet access at remote procurement locations.
TIER 3: SYSTEM ADMINISTRATION
Shakir Annisa
System AdministratorScope: Manages users, locations (warehouse/factory SAP synchronizations), wheat varieties, CSV bulk imports, and quality thresholds (min/max settings).
Pain Point: Quality thresholds differ between ABD and FBD—managing parameters manually is error-prone.
Journey Map: WSP Goods Receipt
The primary flow that initiates the entire traceability chain. We mapped the user actions and corresponding system feedback to reduce cognitive friction at the Mandi warehouse.
Login & Location
User Action: Opens Drishti app at the warehouse gate.
System Response: Verifies GPS coordinates—must be within 500m of the registered warehouse.
Neutral / Mobile AppEnter PO / STO
User Action: Enters Purchase Order or Stock Transfer Order number.
System Response: Fetches details from SAP (Party Name, Variety, Quantity, Rate).
Neutral / App + SAPConnect Hardware
User Action: Pairs the scanning device via Bluetooth/WiFi.
System Response: Displays the connected device list with options to add new hardware.
Slight Friction / App + DeviceScan Grain Sample
User Action: Places the wheat sample on the device and taps Scan.
System Response: Hardware captures the image and sensor telemetries, compiles JSON, and transfers to mobile.
Key Moment / Hardware + AppFill Metadata
User Action: Enters Weight, Infestation, Moisture, Odour, and Hectoliter (HL).
System Response: Generates a unique alphanumeric Sample ID using user + device + timestamp.
Neutral / Mobile AppView Report
User Action: Reviews 14+ quality parameters against min/max thresholds.
System Response: Displays Accept / Reject / Retest options and syncs reports directly to SAP.
Critical Decision / App + SAPAssign Stack
User Action: Selects the target storage stack or creates a new one.
System Response: Updates stack allocation records in SAP and generates a unique Stack ID.
Relief / App + SAPOffline Resilience: If internet connectivity drops, the app caches all sample data locally. Cached samples appear in the queue marked with an orange status indicator. Field operatives can review, edit, and sync records once connectivity is restored.
Journey Map: Lab Technician
Detailed flow mapping for laboratory verification checks performed by FBD factory specialists upon grain arrival at the processing mills.
Select Batch
Selects the incoming transit batch from the pending factory laboratory queue.
Scan Sample
Places a raw sample of the wheat cargo onto the scanning device.
Data Ingestion
System automatically reads sensor telemetry data and links it to the batch record.
Lab Testing
Runs 5 types of specialized lab verification tests (gluten, hectoliter, moisture, etc.).
Verify & Submit
Confirms quality validation parameters and signs off to complete the factory ingestion loop.
Module Access Architecture
To eliminate visual clutter, different roles have access to optimized, context-specific views across mobile, web, and admin surfaces.
Field Operations
- Ingest incoming logs
- Perform grain sampling
- Synchronize BLE scales
- Offline caching queue
- SAP check-in handshakes
Supervisor Control
- Master operational dashboard
- Multi-factory status reports
- Spatial quality mappings
- SAP transaction reconciliations
- Rejection metrics & logs
Configuration Portal
- User management controls
- Location master indices
- Varietal master configs
- CSV bulk imports for data updates
- Threshold min/max controls
Core Quality Innovation
Tracing wheat quality from farm gate to factory floor
Every crop batch is mapped to a digital certificate, bridging physical quality metrics directly to enterprise systems (SAP). This replaces visual checks with objective, verifiable telemetries.
By tracking grain moisture, purity, and temperature at every step, we prevent mixing errors, reduce factory rejects, and establish an immutable record for the entire FMCG supply chain.
Farm Gate
Moisture meter BLE sync & initial tagging.
Mandi Warehouse
Receipt verification & dispatch clearance passes.
Processing Factory
Stack allocation & digital certificate integration.
Extreme Conditions Design
Designing software for noisy, dusty agricultural mandis with high sun glare and limited connectivity requires shifting focus from standard design aesthetics to high-contrast utility.
Offline-First UI Architecture
App operates in remote storage depots with highly volatile connections. Caches logs locally and uses orange badge highlights to provide clear, anxiety-free feedback to operators.
Inclusive UX Design
High-contrast colors, simplified typography, and large touch targets tailored to combat sun glare, dust, and visual fatigue for an older (45+ age), non-tech-native worker base.
Hardware (BLE) Integration
Directly pairs handheld grain analysis sensors to mobile apps. Shows persistent pairing indicators and calibration checks in the active viewport to manage connection errors.
SAP Core Integration
Bridging physical measurements directly into enterprise databases. Translates complex server codes into plain-language success states for field workers.
Traceability Dashboard
Supplying quality at scale. Below is the interactive Traceability Dashboard representing simulated grain telemetries. Use the status tabs to inspect current wheat logs.
| Batch ID | Crop Variety | Quality Score | Moisture % | Temp | Weight | Status |
|---|---|---|---|---|---|---|
| BATCH-2026-081 | Wheat (LOK-1) | 94% | 12.1% | 27°C | 8,500 Kg | APPROVED |
| BATCH-2026-082 | Wheat (Sharbati) | 68% | 16.5% | 29°C | 4,200 Kg | REJECTEDHigh moisture (rejection threshold >14.0%) |
| BATCH-2026-083 | Barley (Pusa) | 88% | 11.8% | 26°C | 6,000 Kg | APPROVED |
| BATCH-2026-084 | Wheat (Kalyan) | 91% | 13.0% | 28°C | 9,100 Kg | QUEUEDOffline cached. Sync pending |
| BATCH-2026-085 | Wheat (Durum) | 55% | 18.2% | 30°C | 5,500 Kg | REJECTEDImpurity rating (weed seed count high) |
| BATCH-2026-086 | Wheat (Malav) | 96% | 11.9% | 25°C | 12,000 Kg | APPROVED |
| BATCH-2026-087 | Wheat (Sharbati) | 93% | 12.5% | 27°C | 7,800 Kg | APPROVED |
Supply Chain Transformation Comparison
| Parameter | Before Drishti | After Drishti (With Platform) |
|---|---|---|
| Audit Trail | Paper-based, slow, and fragmented | Real-time, unified, and cryptographically verified |
| Quality Variance | High subjectivity (palm feel metrics) | Objective and standardized via BLE analyzer nodes |
| Truck Turnaround | 4+ hours of manual queue bottlenecks | Under 1.5 hours via automated gate passes |
| Data Reconciliation | Manual spreadsheets prone to entry errors | Instant background synchronization with SAP core |
Mobile Experience Design
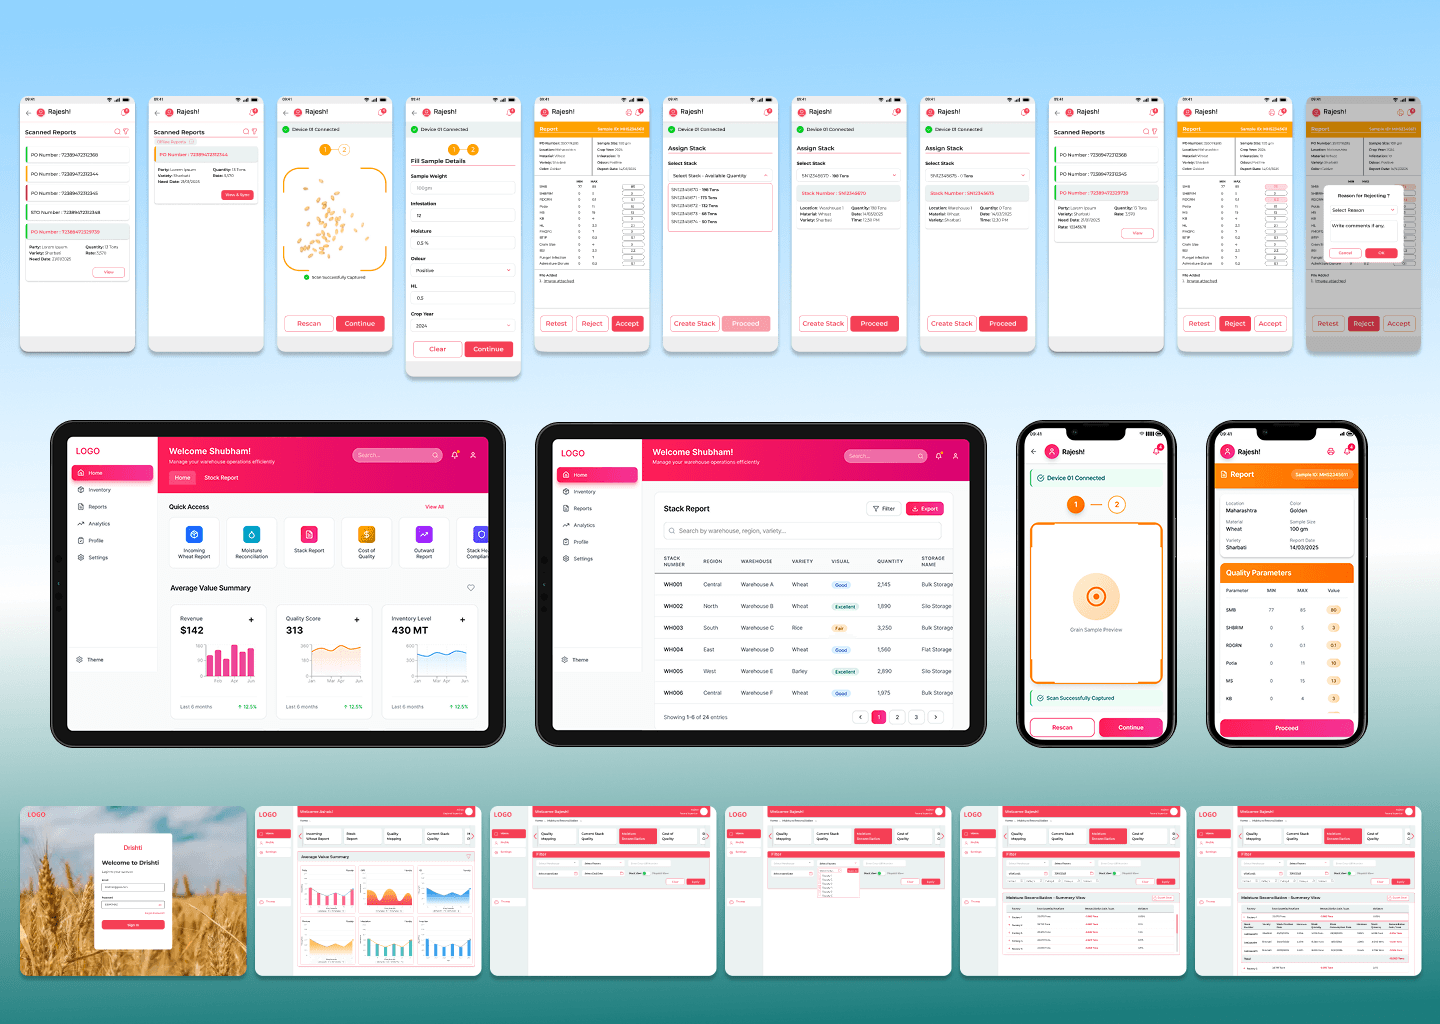
Handheld mobile flows designed to standardise crop telemetry capture. Features high-contrast pairing widgets, calibration diagnostics, and simple red/green quality indicators.
Dashboard & Quality Analytics
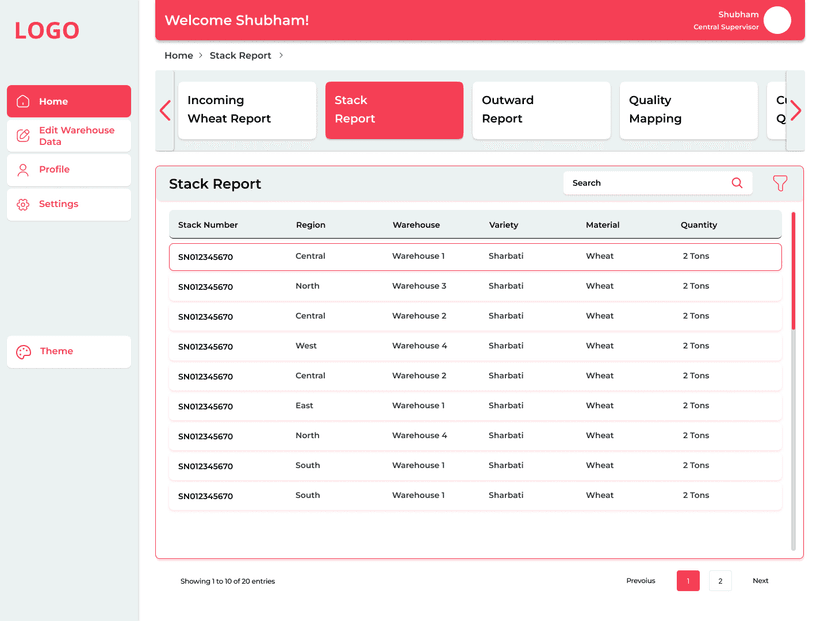
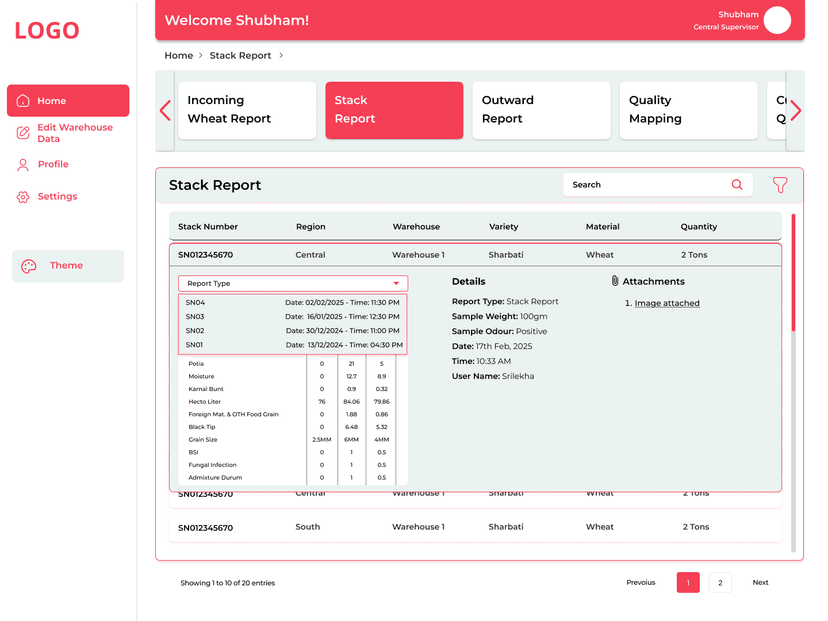
Review high-fidelity mockups of the regional supervisor stack reports, expanded audit sheets, and multi-location tracking maps.
Retrospective
Project Drishti proved that the value of digital transformation isn't in the hardware, but in how it respects the Dignity of the Human Workforce. By designing for a 45+ age workforce, we bridged the gap between enterprise-level precision and ground-level reality.
The biggest shift was learning to design for hardware observability as a first-class UX requirement. An integrated app that fails to communicate its connection status is an app that users will abandon in favor of pen-and-paper workarounds.
What emerged was a collection of interaction patterns for hardware-software integration: contextual pairing widgets, tactile form feedback, auto-reconnect signals, and offline assurance states that keep the user in control even in low-connectivity environments.
Technology must adapt to environment. Design for glare, noise, and physical fatigue.
Friction can build trust. Confirmation dialogs prevent costly accidental submit errors.
Surfaced metrics must be actionable. Tell the agent exactly why a reading failed.
Passive feedback reduces anxiety. Keep BLE signal status visible at all times.
Dignity is a design metric. Treat non-tech-native workers as enterprise experts.
Ecosystem Feedback
Perspectives from users, colleagues, and stakeholders.
"The visual overlays and immediate trust markers are exceptional. By removing the need for dense instructional training, we saw a massive drop in operator configuration errors."
"The color coding on the dashboard helps me check the signal in one glance. However, adding a warning beep when the connection starts dropping would help me react faster on the floor."
"Bridging heavy hardware telemetry with simple visual indicators is a masterpiece. The learning curve was virtually flat, and we saw immediate field efficiency improvements that exceeded all business forecasts."
Have thoughts on this?
Whether it's a critique, an idea, or a potential collaboration, I'd love to hear your perspective.